Data Visualization using Tableau
Tableau is a trending and market-leading BI tool used to visualize and analyse your data in an easily digestible format. It allows you to work on live data-set and spend more time on data analysis rather than data wrangling.
Let us consider the following example to understand this:The following image shows the x and y co-ordinates of different points to be plotted on a graph. The numbers look almost the same, don’t they? Maybe the lines will look similar after we plot each set on the graph.
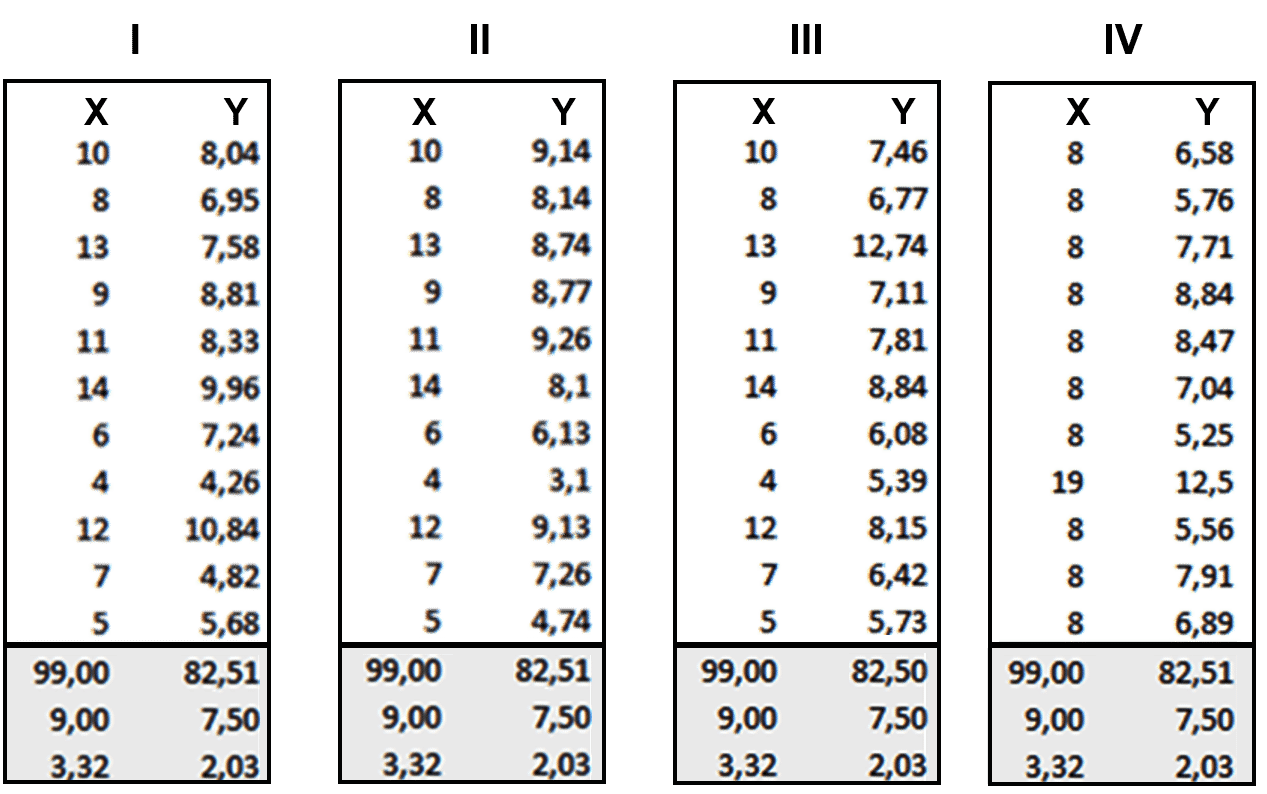
So, now take a look at the image below when we plot these points in our graph:
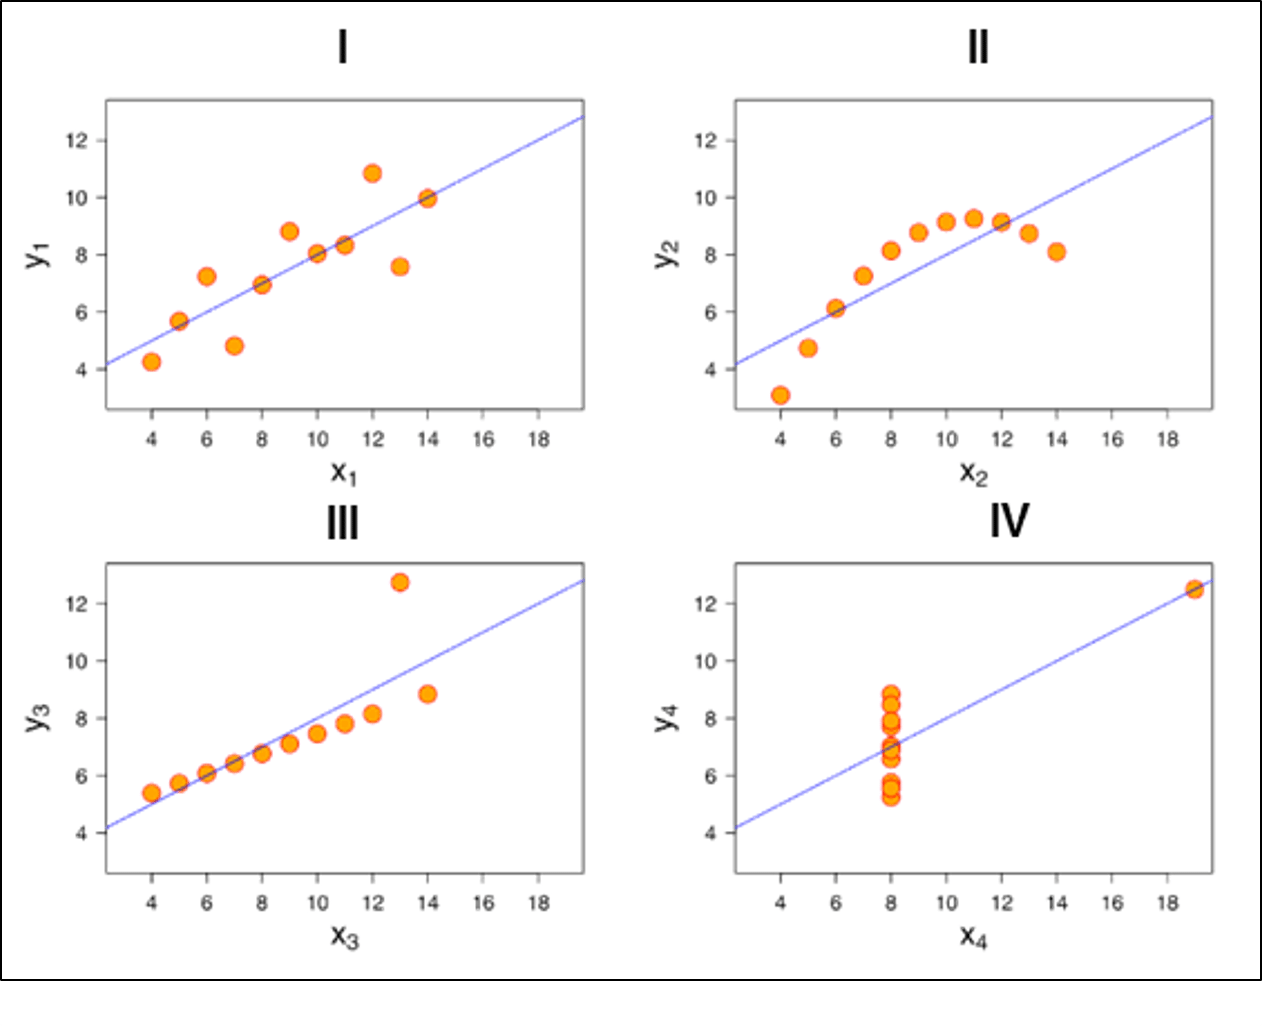
You see how different they look like when you actually visualize it. It wasn’t possible for us to figure out the nature of each line until we visualized it.
Difference between Excel and Tableau
Excel works with rows and columns in spreadsheets whereas Tableau enables in exploring excel data using its drag and drop feature. Tableau formats the data in Graphs, pictures that are easily understandable.
|
Parameters
|
Excel
|
Tableau
|
|
Purpose
|
Spreadsheet application used for manipulating the data.
|
Perfect visualization tool used for analysis.
|
|
Usage
|
Most suitable for statistical analysis of structured data.
|
Most suitable for quick and easy representation of big data
which helps in resolving the big data issues.
|
|
Performance
|
Moderate speed with no option to quicken.
|
Moderate speed with options to optimize and enhance the
progress of an operation.
|
|
Security
|
The inbuilt security feature is weak when compared to Tableau.
The security update needs to be installed on a regular basis.
|
Extensive options to secure data without scripting. Security
features like row level security and permission are inbuilt.
|
|
User Interface
|
To utilize excel to full potential, macro and visual basic
scripting knowledge is required
|
The tool can be used without any coding knowledge.
|
|
Business need
|
Best for preparing on-off reports with small data
|
Best while working with big data.
|
|
Products
|
Bundled with MS Office tools
|
Comes with different versions such as the Tableau server,
cloud, and desktop.
|
|
Integration
|
Excel integrates with around 60 applications
|
Tableaus integrated with over 250 applications
|
|
Real time data exploration
|
When you are working in excel, you need have an idea of where
your data takes you to get to know the insights
|
In Tableaus, you are free to explore data without even knowing
the answer that you want. With the in-built features like data blending and
drill-down, you will be able to determine the variations and data patterns.
|
|
Easy Visualizations
|
When working in excel, we first manipulate the data that is
present and then the visualization such as the different charts, graphs are
created manually. To make the visualizations easily understandable, you
should understand the features of excel well.
|
Whereas in Tableau, the data is visualized from the beginning.
|
Reference:
- https://www.edureka.co/blog/tableau-tutorial/
- https://www.guru99.com/what-is-tableau.html
No comments:
Post a Comment